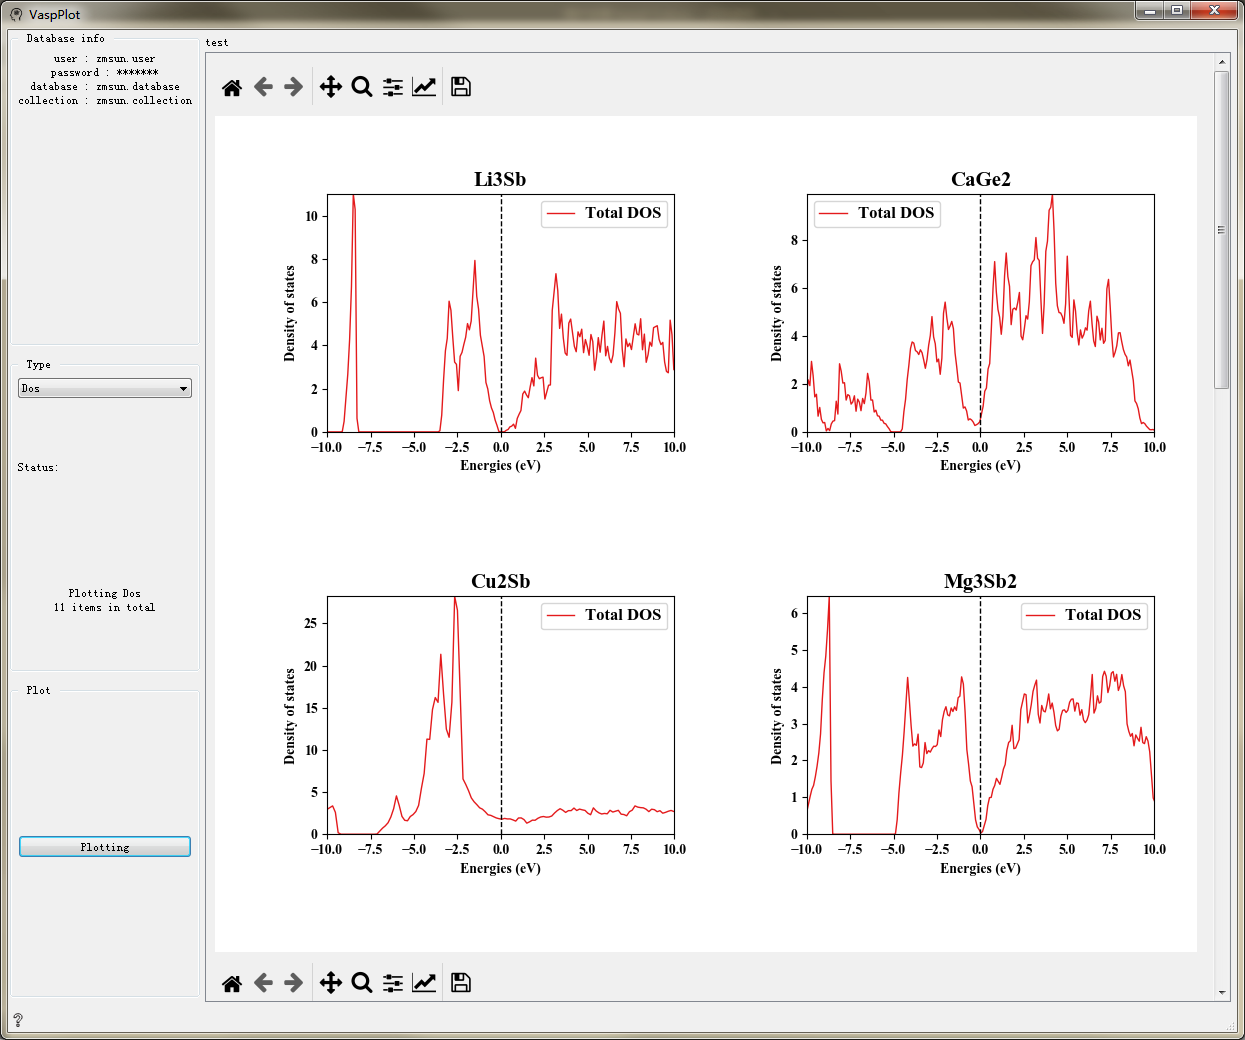
Drawing And Analysis Controls
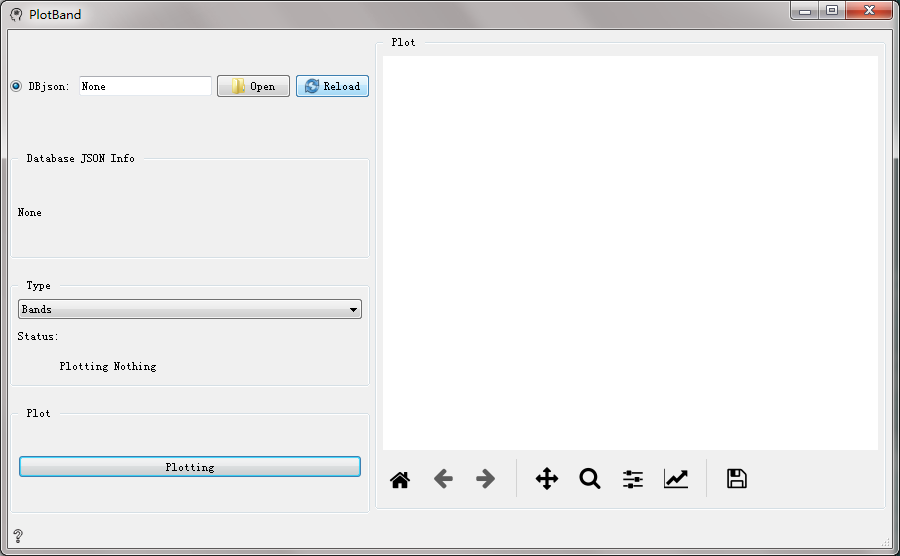
PlotBand controls
Used to draw the energy band structure.
Input |
Output |
|---|---|
file path |
file path |
Parameter configuration:
Open                                       Open and load JSON format file

Reload                                     Reload file

Database JSON Info                         Related information of JSON file

Type                                       Choose the type you need, include Bands,PBands,Dos,PDos,COHP,Boltranp,E-V,Cp-T,Formation Erengy,RDF,MSD

Status                                     Current state

Plotting                                   Draw plot
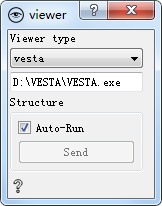
viewer controls
Used to view the structure.
Input |
Output |
|---|---|
Structure |
Structure |
Parameter configuration:
Viewer type                                Select the opening method, including vesta, custom, etc. The installation path of the software can be filled in below

Auto-Run                                   When checked, the output of the control can be automatically transferred to the next control. When unchecked, you can manually click send transmission, which is checked by default
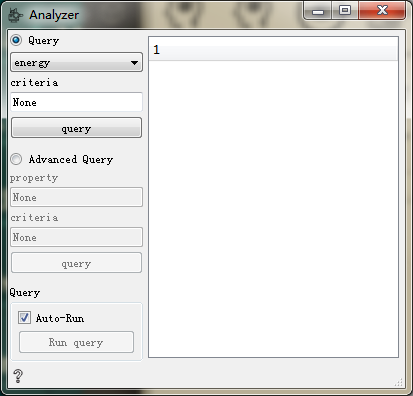
Analyzer controls
Used to analyze calculation results.
Input |
Output |
||
|---|---|---|---|
Database |
dict |
Table |
Database |
Parameter configuration:
Query                                      Select one of energy, volume, bandgap, dos, band for analysis

    ID or criteria                         Enter ID or criteria
    query                                  Click to query

Advanced Query                             Advanced Query

    property                               Enter the property of the query
    criteria                               Enter the criteria
    query                                  Click to query

Auto-Run                                   If it is checked, it can be queried automatically. If it is not checked, you can manually click Run query. It is checked by default
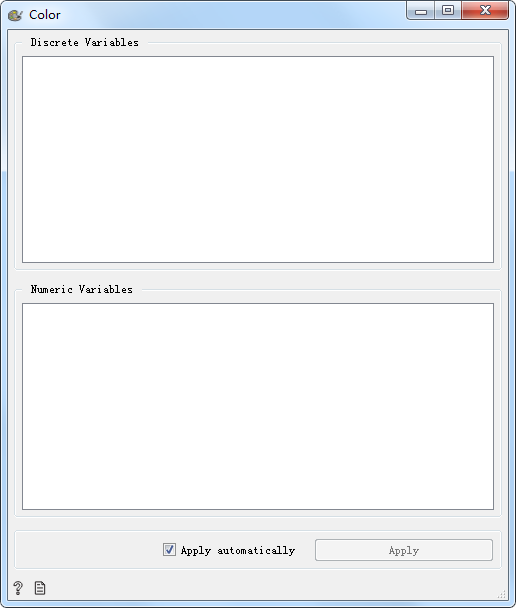
Color controls
Used to set the color legend of the variable.
Input |
Output |
|---|---|
Data |
Data |
Parameter configuration:
Discrete Variables                         Set the color display of discrete variables

Numeric Variables                          Set the color display of numeric variables

Apply automatically                        When it is checked, the settings can be automatically applied. When it is not checked, you can manually click Apply application settings, which is checked by default
Distributions controls
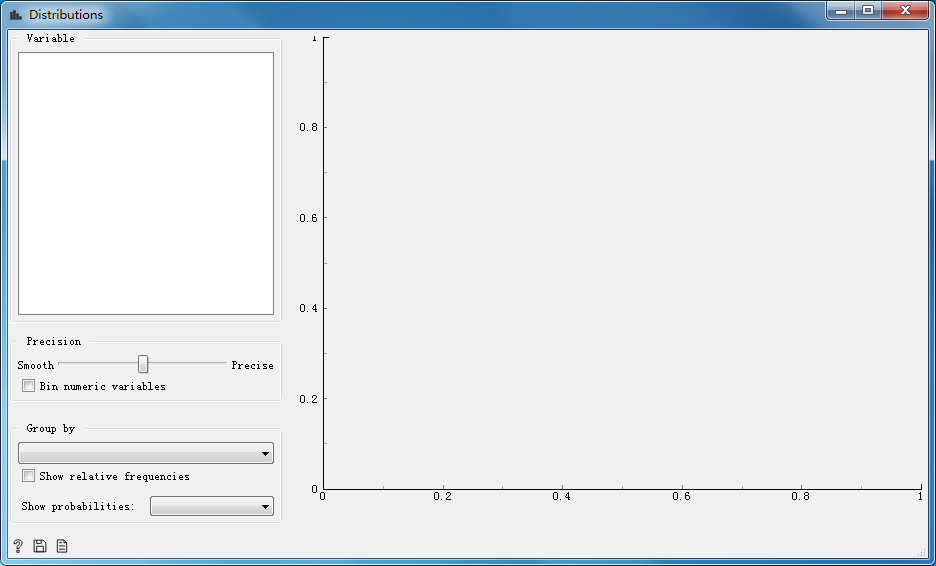
Display the value distribution of data elements with charts.
Input |
Output |
|---|---|
Data |
None |
Parameter configuration:
Variable                                   Selectable variables

Precision                                  Set the fineness of the image, from smooth to fine

    Bin numeric variables                  The bar chart shows the numerical variables

Group by                                   Choose classification basis

    Show relative frequencies              Show relative frequencies
    Show probabilities                     Show probabilities
Scatter Plot controls
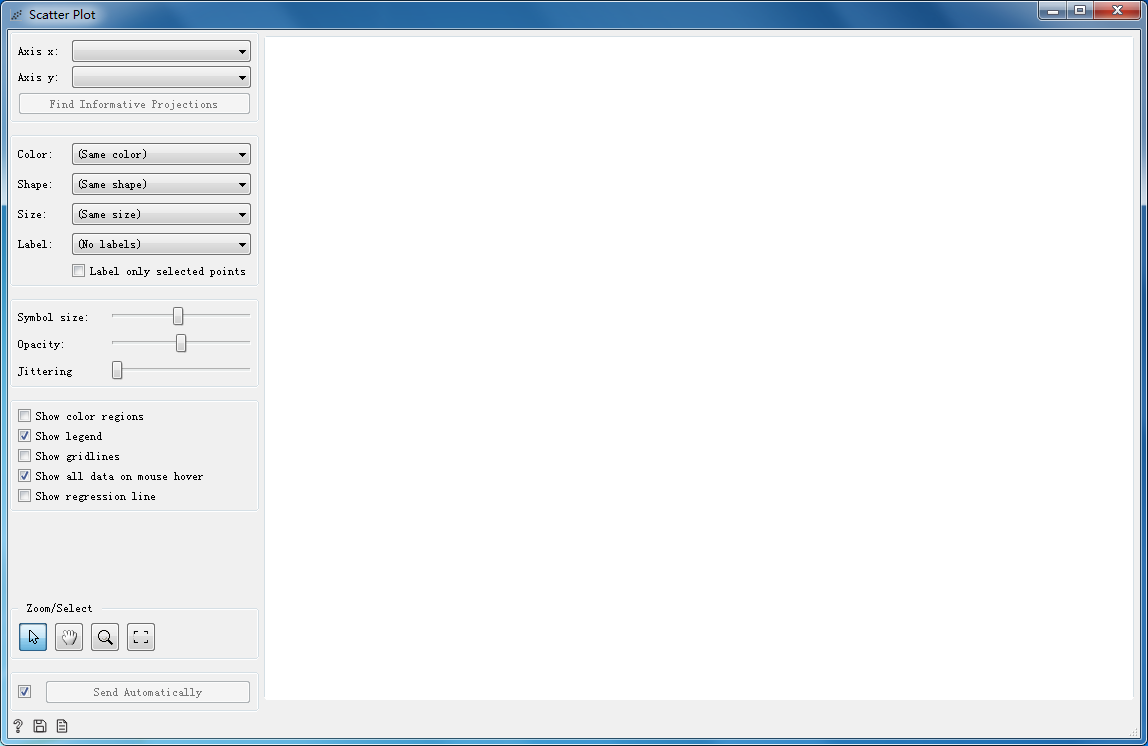
Used to draw scatter plots of various data.
Input |
Output |
||||
|---|---|---|---|---|---|
Data |
Data Sunset |
Features |
Selected Data |
Data |
Features |
Parameter configuration:
Axis x                                     Select data for Axis x

Axis y                                     Select data for Axis y

Find Information Projection                Find Information Projection

Color                                      Set color

Shape                                      Set shape

Size                                       Set size

Label                                      Add label

    Label only selected points             Label only selected points

Symbol size                                Set symbol size

Opacity                                    Set opacity

Jittering

Show color regions                         Show color regions

Show legend                                Show legend

Show gridlines                             Show gridlines

Show all data on mouse hover               Show all data on mouse hover

Show regression line                       Show regression line

Send Automatically                         When checked, the output of the control can be automatically transferred to the next control. When unchecked, you can manually click send automatically transfer, which is checked by default
VaspPlot controls
Used to draw DOS and Band diagrams.
Input |
Output |
|---|---|
PlotDict: dict |
None |
Parameter configuration:
Type                                       Choose drawing type

Plotting                                   Plotting
