Statistics on the probability of different grid points in complex compounds
According to the first-principles calculation of the potential barrier of vacancy diffusion, this example simulates the model Carlo simulation of the mesoscopic scale, and obtains statistics of the probability of different lattice points in the complex compound. After completing the first-principles NEB calculation, link to Kmc Run Li to perform the calculation, and finally draw the graph through Kmc Plot, the complete flow chart is as follows:

The first step is to manually connect the controls, or click File, Open and Freeze, click to open the corresponding sample template file and click the start button, as shown in the figure:

Steps 2 to 5 are the same as the above example, not repeat them here;
The sixth step is to click
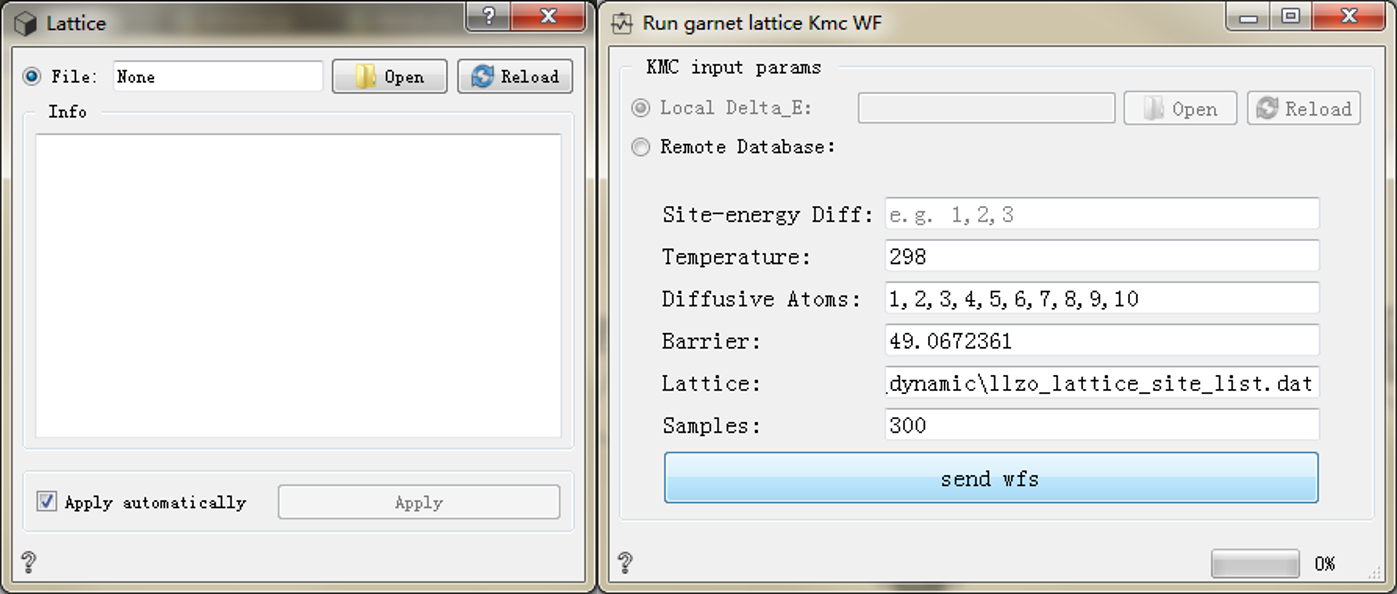
Lattice, the data crystal structure file, as shown in the figure:The seventh step is to click
Run garnet lattice Kmc WFto configure the parameters, as shown in the figure:

The eighth step: submit the task in Jobs(1) and wait for the calculation to end;
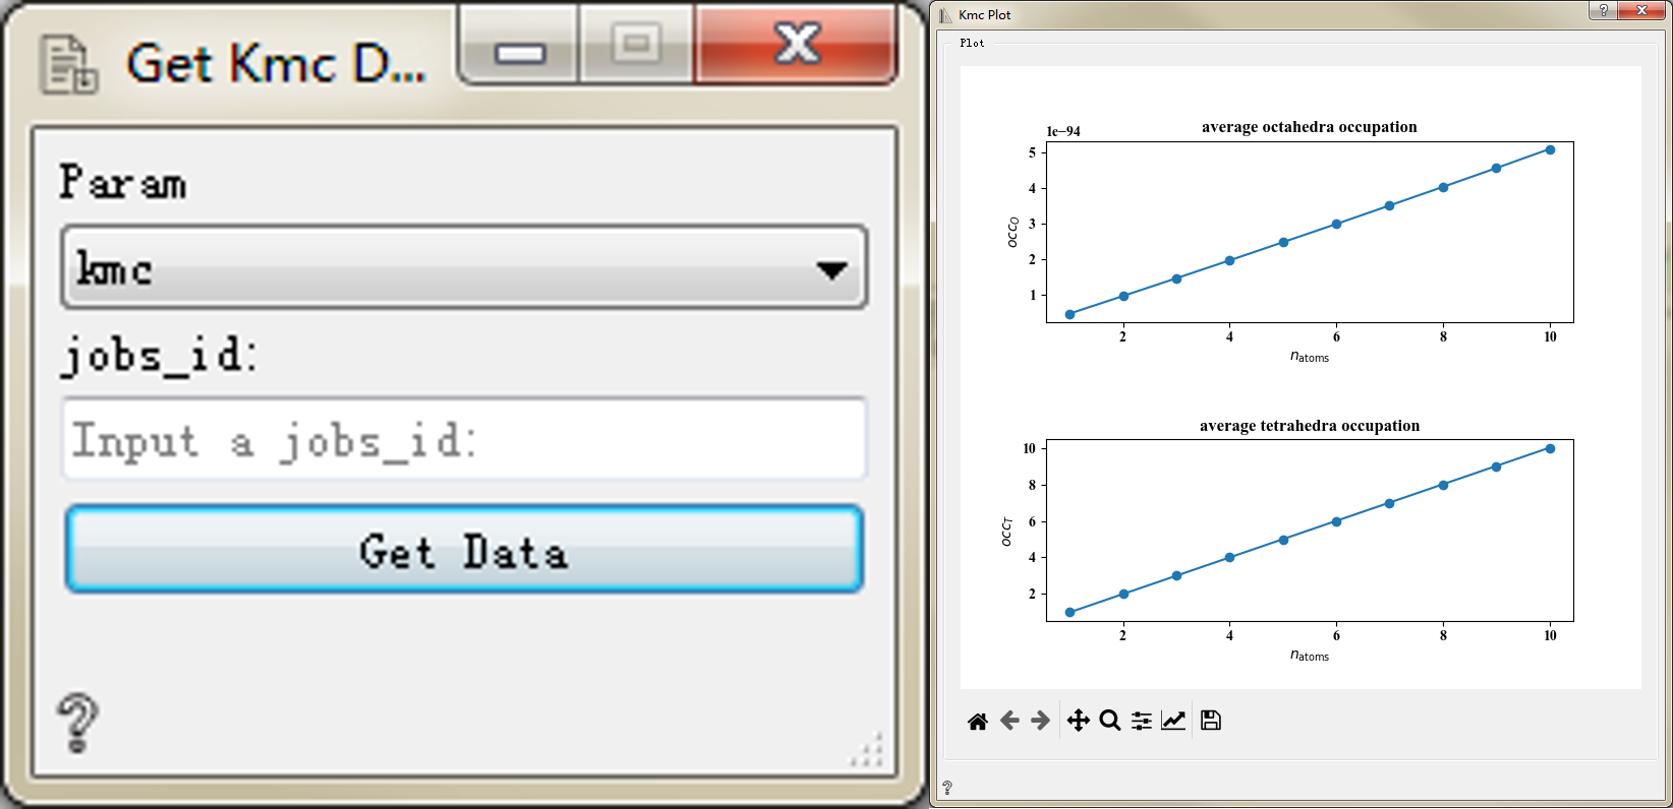
Step 9: Click
Get Kmc Dataand enter jobs_id to transfer data to Kmc Plot, as shown in the figure:The tenth step: click
Kmc Plotto draw an image, as shown in the figure:
